
Is the Tide Turning for High-Quality Small Caps?
Download PDFThe evidence behind today’s opportunity for quality-oriented active investing
The past fifteen months have been among the most challenging environments for high-quality small cap investing in the past four decades. Market leadership has been dominated by a narrow group of speculative, high-beta* companies, creating conditions rarely observed in modern market history. While no one can predict exactly when leadership will change, history suggests these extreme periods have not persisted indefinitely. For institutional investors, the question is not whether history will repeat exactly. It’s whether today’s market conditions warrant re-evaluating an asset class and investment style that many have reduced or overlooked following an unusually difficult period — and this stretch has made that question hard to ignore.
High-quality companies have materially underperformed lower-quality businesses over the past fifteen months ending June 30, 2026. While quality periodically falls out of favor during speculative market phases, the current magnitude and duration of underperformance has occurred only four other times since 1986.
Exhibit 1: High-Quality Relative Performance at Extreme Levels
Trailing 15-Month Annualized Net Relative Return (R2 Profitable Stocks)
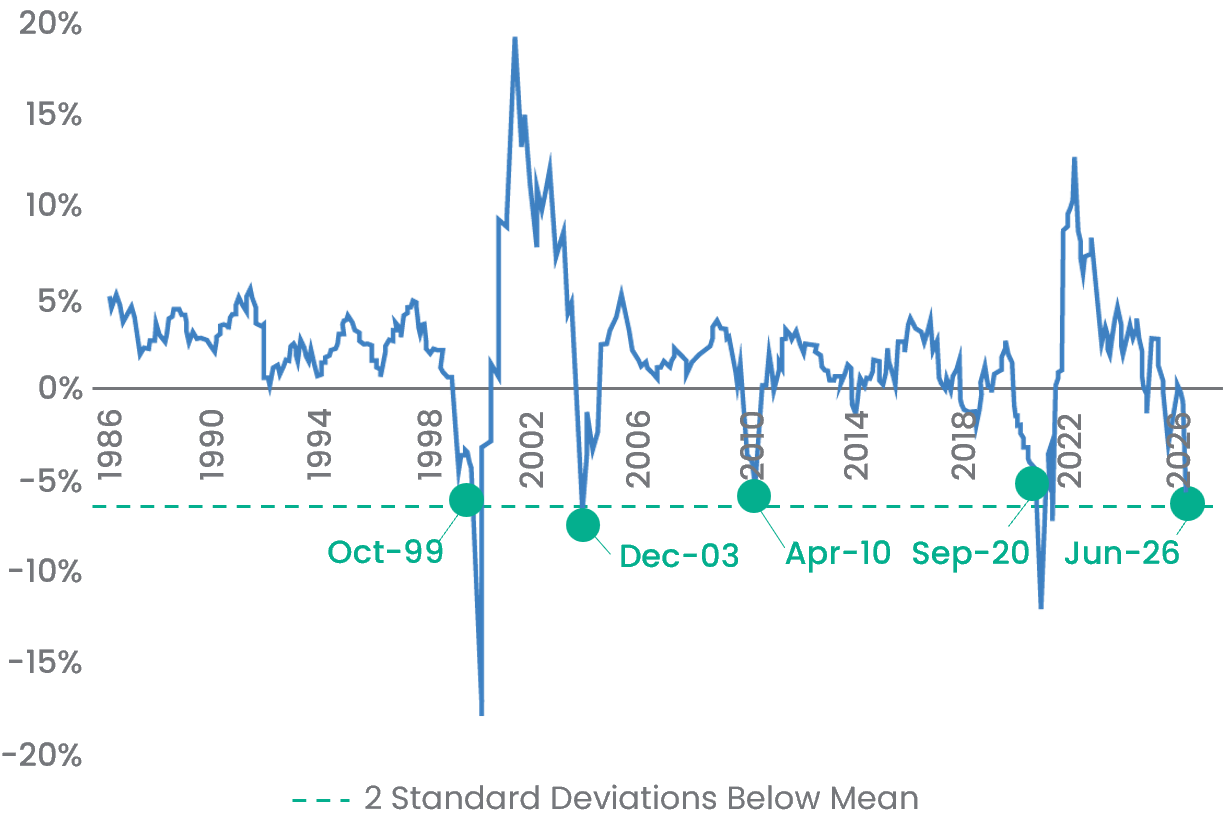
Source: FRP, FactSet, Morningstar; as of 6/30/26. R2=Russell 2000 Index; the Russell 2000 Index measures the performance of the small cap segment of the U.S. equity universe. It includes approximately 2000 of the smallest securities based on a combination of their market cap and current index membership. Performance in periods longer than 12 months is annualized. Past performance is not a guarantee or indicator of future results. High-Quality: Conestoga defines high-quality as investing in companies with strong returns on capital, durable earnings growth, sturdy balance sheets, and meaningful management ownership.
*Beta is a measure of the volatility, or systematic risk, of a security or a portfolio in comparison to the market as a whole.
History suggests an important question: What has typically happened following prior periods of extreme high-quality underperformance?
While every market cycle is different and past performance does not guarantee future results, prior periods of extreme high-quality underperformance have historically been followed by stronger relative returns for profitable, higher-quality businesses over the subsequent twelve to eighteen months.
Exhibit 2: Forward Returns After Prior Extremes
R2 Profitable Stocks’ Net Relative Return
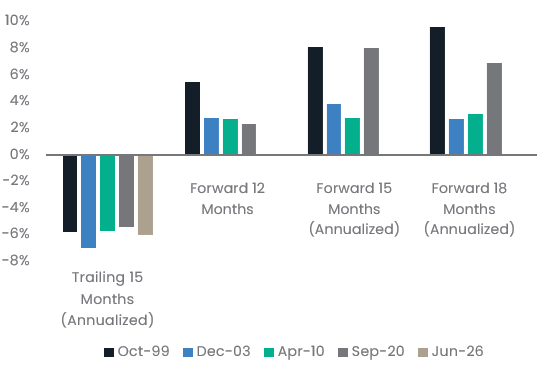
Source: FRP, FactSet; as of 6/30/26. R2=Russell 2000 Index. See Investment Definitions for benchmark methodology and description. Performance in periods longer than 12 months is annualized. Past performance is not a guarantee or indicator of future results. The chart reflects selected historical periods rather than standardized performance. This analysis is illustrative market commentary based on a subset of securities and is not representative of any portfolio or all investment outcomes. It is not a recommendation to buy or sell any security.
Does today’s market present a similar opportunity?
History provides a useful framework, but extreme underperformance alone does not necessarily create an attractive investment opportunity. Valuation also matters.
Historically, some of the more compelling opportunities for Conestoga’s investment style have occurred when periods of extreme quality underperformance coincided with relatively favorable valuations. Today, relative valuations remain near the lower end of their historical range, suggesting the opportunity set may be more attractive than it has been in many prior periods.
Exhibit 3: Opportunity May Still Be Ahead
Conestoga Small Cap Fund: CCASX (as of 6/30/26)
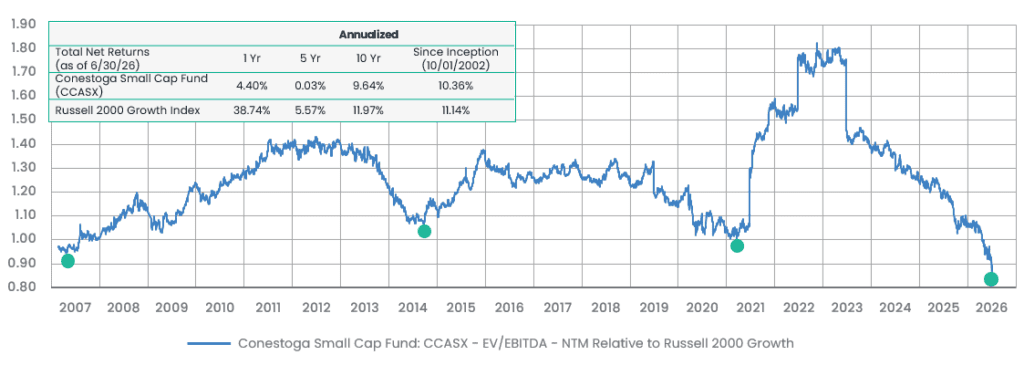
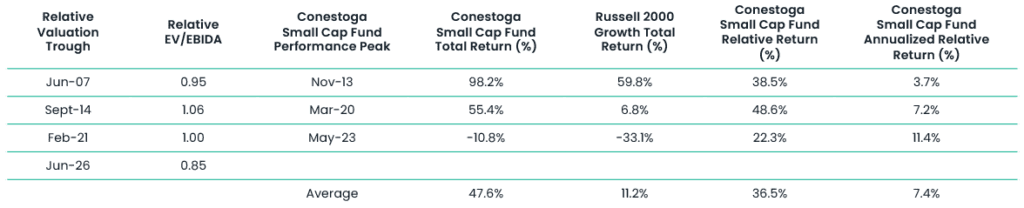
Source: Factset, Conestoga. Fund total returns are shown net of fees and expenses and reflects the reinvestment of dividends and capital gains. The performance data quoted represents past performance. Current performance may be lower or higher than the performance data quoted above. Past performance is no guarantee of future results. The investment return and principal value of an investment will fluctuate so that investor’s shares, when redeemed, may be worth more or less than their original cost. For performance information current to the most recent month-end, please call toll-free 1-800-494-2755. The Russell 2000 Growth Index measures the performance of those Russell 2000 companies with higher price-to-book ratios and higher forecasted growth values. The Russell 2000 Index is an index that measures the performance of the 2,000 smallest companies in the Russell 3000 Index. Gross Expense ratio: 1.46%; Net Expense ratio: 1.10%. These are expenses that you pay each year as a percentage of the value of your investments. Conestoga Capital Advisors, LLC (the Adviser) has contractually agreed to limit the Fund’s net annual operating expenses to 1.10% of the Fund’s average daily net assets until at least January 31, 2026, subject to termination at anytime at the option of the Fund. There is no guarantee that the agreement to limit the Fund’s net annual operating expense will be renewed or extended. The EV/EBITDA (Enterprise Value to Earnings Before Interest, Taxes, Depreciation, and Amortization) ratio is a widely used financial valuation metric that compares a company’s total value (including debt) to its operational cash earnings. It helps investors and analysts assess if a company is undervalued or overvalued relative to its peers and is particularly useful for comparing companies with different capital structures or tax situations. NTM = Next twelve months. Relative return measures an investment’s performance compared to a market benchmark.
Why This Matters
Extreme underperformance and depressed valuations have rarely aligned as they appear to today. In prior instances when this combination occurred, quality-oriented strategies have often gone on to deliver stronger relative performance. That pattern is what makes the current environment worth a closer look.
If market leadership broadens and investors begin placing greater emphasis on durable business fundamentals rather than speculative momentum, we believe high-quality active managers could be well positioned. Conestoga’s investment philosophy emphasizes businesses with strong balance sheets, sustainable earnings growth, and durable competitive advantages — the same characteristics that have historically mattered most once markets move past speculative extremes. For institutional investors who reduced exposure to quality-oriented strategies during this period, the current setup offers a timely opportunity to revisit that decision.
Disclosures
Past performance is not a guarantee or indicator of future results.
This document does not constitute advice or a recommendation or offer to sell or a solicitation to deal in any security or financial product. It is provided for information purposes only and on the understanding that the recipient has sufficient knowledge and experience to be able to understand and make their own evaluation of the proposals and services described herein, any risks associated therewith and any related legal, tax, accounting or other material considerations. To the extent that the reader has any questions regarding the applicability of any specific issue discussed above to their specific portfolio or situation, prospective investors are encouraged to contact Conestoga Capital Advisors, LLC.
This document is confidential, is intended only for the person to whom it has been directly provided and under no circumstances may a copy be shown, copied, transmitted or otherwise be given to any person other than the authorized recipient without the prior written consent of Conestoga Capital Advisors, LLC.
Any indices and other financial benchmarks shown are provided for illustrative purposes only, are unmanaged, reflect reinvestment of income and dividends and do not reflect the impact of advisory fees. Investors cannot invest directly in an index. Comparisons to indexes have limitations because indexes have volatility and other material characteristics.
Certain information contained herein constitutes “forward-looking statements”. Due to various risks and uncertainties, actual events, results or actual performance may differ materially from those reflected or contemplated in such forward-looking statements. Nothing contained herein may be relied upon as a guarantee, promise, assurance or a representation as to the future.
An investor should consider investment objectives, risks, charges, and expenses carefully before investing. Download a prospectus at www.conestogafunds.com, which contains this information or call toll free 1-800-494-2755. Read the prospectus carefully before investing or sending money.
Mutual Fund Investing involves risk, principal loss is possible. Investment in the Fund is subject to investment risks, including, without limitation, equity risk, market risk, management risk, small company risk, mid cap stock risk, foreign investment risk, currency risk, large redemption risk. Funds that invest in small and mid cap stocks are often more volatile than large cap stocks. Smaller companies generally face higher risks due to their limited product lines, markets and financial resources. For more information about the Fund, including the Fund’s objectives, charges, expenses and risks (including more information about the risks listed above), please read the prospectus.
The Conestoga Small Cap Fund is subject to the following additional risks: Small capitalization companies tend to be less liquid and more volatile than stocks of companies with relatively large market capitalizations. Foreign investments pose additional risks including those relating to political, economic and regulatory events and circumstances unique to a country or region will affect those markets and their issuers. Technology companies may be subject to greater price volatility than securities of companies in other sectors. These securities may fall in and out of favor with investors rapidly, which may cause sudden selling and dramatically lower market prices. Industrial companies may be affected by changes in domestic and international economies and politics, consolidation, excess capacity, changes in supply and demand for products and services, product obsolescence, claims for environmental damages or product liability, and general economic conditions.
Investment Definitions: High-Quality: Conestoga defines high-quality as investing in companies with strong returns on capital, durable earnings growth, sturdy balance sheets, and meaningful management ownership. Beta is a measure of the volatility, or systematic risk, of a security or a portfolio in comparison to the market as a whole. Beta is used in the capital asset pricing model (CAPM), a model that calculates the expected return of an asset based on its beta and expected market returns. Standard Deviation is a statistical measurement that sheds light on historical volatility; higher standard deviations indicate higher levels of historical volatility. Mean represents the mathematical average of a set of financial data points, such as investment returns, stock prices, or valuation multiples. The Russell 2000 Index measures the performance of the small cap segment of the U.S. equity universe. It includes approximately 2000 of the smallest securities based on a combination of their market cap and current index membership. The Russell 2000 Growth Index measures the performance of the small cap growth segment of the U.S. equity universe. It includes those Russell 2000 companies with higher price-to-value ratios and higher forecasted growth values.
For additional information, please contact Conestoga Capital Advisors, LLC at: : info@conestogacapital.com.. You may also call us at 484-654-1380 or visit us on the web at www.conestogacapital.com. The Conestoga Small Cap Fund can be purchased fund direct or is available through mutual fund platforms. Please visit www.conestogacapital.com or contact Conestoga Capital Advisors for additional instructions.