
When Capital Gets More Expensive: Why Quality May Matter More
Download PDFFor much of the last fifteen years, investors operated in a world defined by low inflation, falling interest rates, and abundant liquidity. Those conditions rewarded long-duration assets, speculative growth companies, and businesses whose profitability remained far in the future. As discount rates declined, investors were willing to pay increasingly higher multiples for future earnings streams. Today, that backdrop may be changing.
The Cost of Debt Is Starting to Matter Again
The recent rise in long-term Treasury yields has become difficult to ignore. The yield on the 30-year U.S. Treasury recently surpassed 5.2%, its highest level since 2007. While market commentary often focuses on what higher yields mean for economic growth or Federal Reserve policy, we believe the more important question is what they may be signaling about the long-term relationship between government spending, inflation, and capital allocation.
Exhibit 1: The Era of Cheap Capital May Be Over
U.S. Treasury Yield: 30 Year
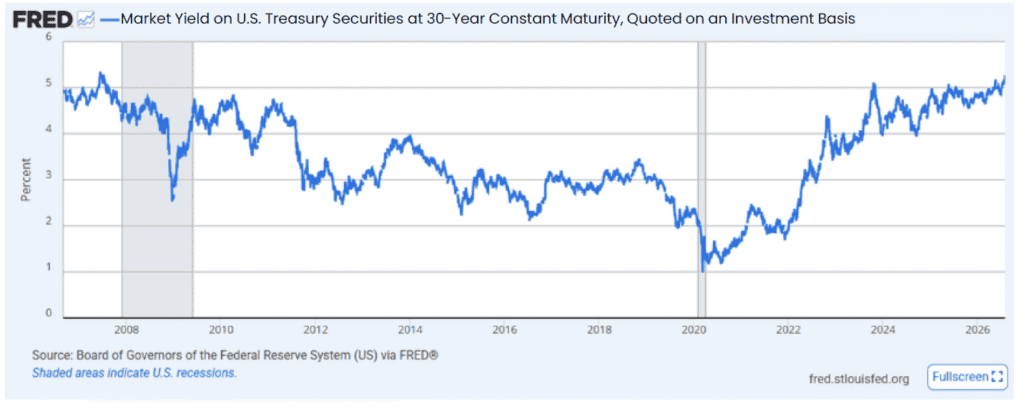
Source: Board of Governors of the Federal Reserve System via FRED®: 30-year U.S. Treasury constant maturity rate, quoted on an investment basis. Data shown from 8/31/2006 to 7/31/2026. Units: Percent, Not Seasonally Adjusted. Frequency: Daily. Shaded areas indicate U.S. recessions. For informational purposes only and not investment advice or a recommendation to buy or sell any security. Views are subject to change. Past market conditions are not necessarily indicative of future market conditions or investment results.
At its core, a rising long-term Treasury yield reflects more than current economic conditions. It also reflects investors’ expectations for future inflation, fiscal sustainability, and the growing supply of government debt. As federal debt levels continue to expand, higher borrowing costs translate directly into higher interest expense for the U.S. government.
This distinction matters.
Unlike investments in infrastructure, technology, or research and development, interest expense does not increase the economy’s productive capacity. Every dollar directed toward servicing debt is a dollar that cannot be invested elsewhere.
As a growing share of government spending is devoted to existing obligations, fewer resources remain available to support future economic growth.
For years, this tradeoff attracted relatively little attention because borrowing costs remained low. That may no longer be the case.
Exhibit 2: The Hidden Costs of Higher Rates
Interest as Percent of Gross Domestic Product
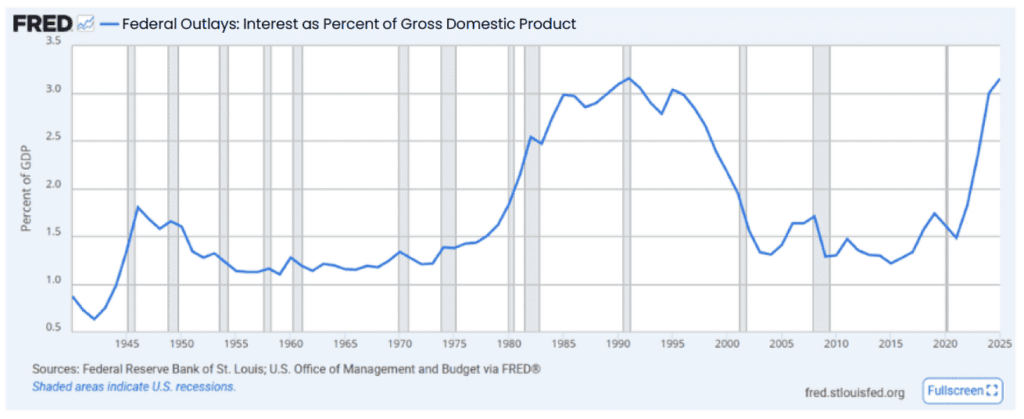
Source: Federal Reserve Bank of St. Louis; U.S. Office of Management and Budget, via FRED®: Interest as Percent of Gross Domestic Product. Data as of 1/01/1940 to 1/01/2025. Units: Percent of GDP, Not Seasonally Adjusted. Frequency: Annual. Shaded areas indicate U.S. recessions.
As debt levels and interest costs rise, policymakers face increasingly difficult choices. While inflation is never desirable, history suggests it can become politically easier than large spending cuts, entitlement reform, or significant tax increases. Debt does not become a problem all at once. Rather, it gradually leaves policymakers with fewer attractive options. The result can be a market that demands a higher inflation risk premium, which may help explain why long-term Treasury yields have moved sharply higher despite moderating inflation data.
Reconsidering the Assumptions of the Last Decade
If this interpretation is correct, investors may need to reconsider some of the assumptions that have driven market leadership over the last decade. The beneficiaries of the post-financial-crisis era were often companies whose value was heavily dependent on earnings expected many years in the future.
When capital is abundant and discount rates are falling, investors can afford to focus on possibilities. When capital becomes scarcer and interest rates rise, investors tend to become more selective. Current cash flows matter more. Balance sheet strength matters more. Returns on invested capital matter more. In that environment, the market’s emphasis often shifts from speculative growth toward quality.
We believe companies that exhibit high-quality characteristics typically share several attributes: strong free cash flow generation, high returns on invested capital, conservative balance sheets, durable competitive advantages, and the ability to maintain pricing power during inflationary periods.
These attributes have always mattered. However, they become increasingly valuable when the cost of capital is no longer declining, and economic uncertainty begins to rise.
Why Quality May Have the Wind at Its Back
This is particularly relevant today because quality has been significantly out of favor. As we have discussed in prior commentaries, we believe the market since 2025 has been characterized by unusually strong performance from lower-quality, more speculative segments of the market. Internal research from our recent market review highlighted the persistence of this low-quality cycle and our belief that such periods have historically demonstrated to be temporary rather than permanent.
Exhibit 3: Quality Has Rarely Been This Out of Favor
High Quality vs. Low Quality Stocks – R2000 Growth; Trailing 12 Month Return Difference
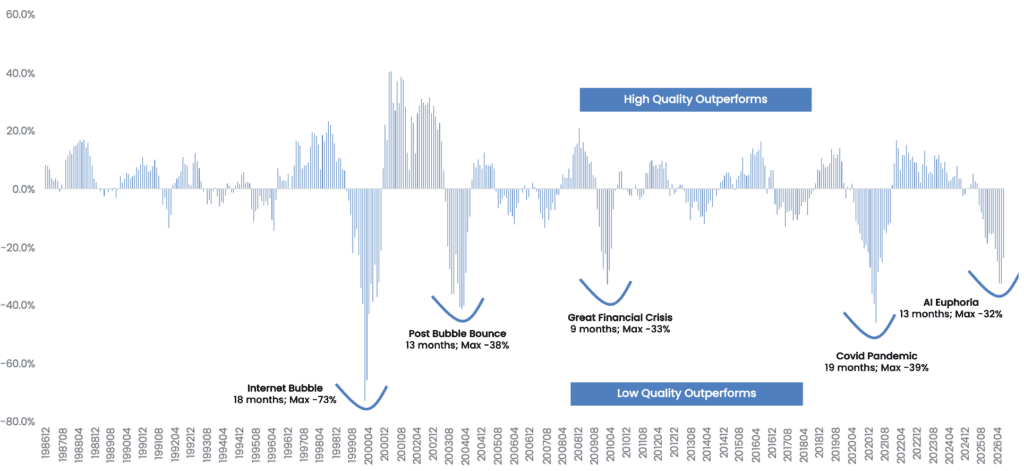
Source: S&P Global. All stocks within the Russell 2000 Growth. The quality rating is an appraisal of past performance of a stock’s earnings and dividends and reflects the long-term growth and stability of a company’s earnings and dividends. High Quality represents stocks rated B+ or higher by S&P. Low Quality represents stocks rated B and below by S&P. No Rating represents securities that S&P has not assigned a quality rating. Portfolios are equal-weighted. Past performance does not guarantee future results. The S&P Quality ratings are not considered to be market recommendations. The Russell 2000 Growth Index measures the performance of those Russell 2000 companies with higher price-to-book ratios and higher forecasted growth values. The Russell 2000 Index is an index that measures the performance of the 2,000 smallest companies in the Russell 3000 Index.
History suggests that market leadership eventually follows economic reality. The specific catalyst is always different, but the pattern is familiar. Speculative leadership often emerges quickly and captures investors’ attention, but it rarely endures.
More durable leadership has historically come from companies capable of consistently generating cash flow, earning attractive returns on capital, and helping create economic value over time.
Conclusion
While no one can predict the precise timing of a market rotation, we believe the combination of elevated Treasury yields, growing fiscal constraints, and the potential for structurally higher inflation creates a backdrop that is increasingly favorable for businesses with strong fundamentals and demonstrated economic value creation.
In other words, if the era of free capital is ending, the era of quality may just be getting started.
Disclosures
Past performance does not guarantee future results. Historical relationships shown may not persist, and actual client results may differ materially.
This material is for informational and educational purposes only and should not be construed as investment advice, a recommendation, or an offer or solicitation to buy or sell any security. Opinions and forward-looking statements are as of the date of publication, are subject to change without notice, and may not come to pass.
Investing involves risk, including possible loss of principal. No investment strategy can guarantee a profit or protect against loss. Quality stocks and small-cap growth stocks can underperform other styles or the broader market. Higher-quality companies are not guaranteed to outperform, and valuation relationships can remain dislocated for extended periods.
Any indices and other financial benchmarks shown are provided for illustrative purposes only, are unmanaged, reflect reinvestment of income and dividends and do not reflect the impact of advisory fees. Investors cannot invest directly in an index. Comparisons to indexes have limitations because indexes have volatility and other material characteristics. The Russell 2000 Growth Index measures the performance of those Russell 2000 companies with higher price-to-book ratios and higher forecasted growth values. The Russell 2000 Index is an index that measures the performance of the 2,000 smallest companies in the Russell 3000 Index.
This document is confidential, is intended only for the person to whom it has been directly provided and under no circumstances may a copy be shown, copied, transmitted or otherwise be given to any person other than the authorized recipient without the prior written consent of Conestoga Capital Advisors, LLC.
Investment Definitions: High-Quality: Conestoga defines high-quality as investing in companies with strong returns on capital, durable earnings growth, sturdy balance sheets, and meaningful management ownership. Return on Invested Capital: (Net income + ((interest expense on debt – interest capitalized) * (1-tax rate))) / average of last year’s and current year’s (total capital + short term debt & current portion of long term debt). The Return on Invested Capital (also known as Return on Capital) measures the profitability of a company as measured by its operating income in relation to the total capital invested in the company.
For additional information, please contact Conestoga Capital Advisors, LLC at: : info@conestogacapital.com.. You may also call us at 484-654-1380 or visit us on the web at www.conestogacapital.com.