
The Transition to Mid-Cycle Favors Quality
Download PDFWhy the longest phase of the business cycle may create a more favorable environment for higher quality, durable growth businesses.
One of the defining characteristics of the stock market since April 2025 has been the strong performance from the most AI-sensitive and higher-beta businesses. History tells us this is what typically happens in the early stages of a new business cycle, when growth reaccelerates from a low base and investors place greater emphasis on improvements in operating leverage and earnings growth than on business quality.*
We believe these market dynamics, however, have begun to shift. Not only has performance leadership broadened out from the Large and Mega Cap stocks to Small Cap stocks, but fundamental quality metrics such as profitability, free cash flow generation, earnings consistency, and balance sheet strength are beginning to outperform as well. 2, 4
These shifts in market leadership are consistent with prior historical periods when the business environment transitioned from early- to mid-cycle, and we think examining this transition may help explain why quality is returning to favor among investors and could provide an enduring tailwind for portfolios like ours.1, 3
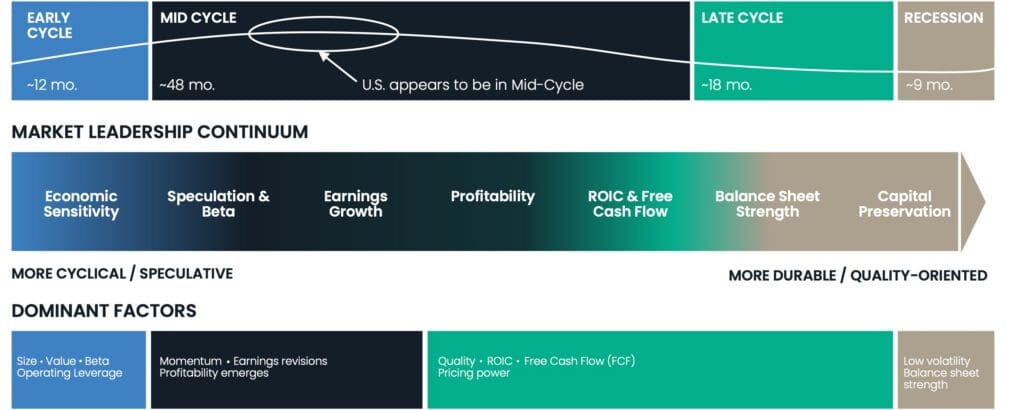
Exhibit 1: The Longest Part of the Business Cycle Rewards Quality
Illustrative average phase durations: Early (~1 year), Mid (~4 years), Late (~1.5 years), Recession (9 months)
Source: Fidelity Investments. Business-cycle classifications and phase durations are illustrative and subjective. Economic and market cycles may differ materially from historical patterns, and market leadership may not change as described.
*Quality is a subjective investment assessment used by Conestoga and may include profitability, earnings and revenue durability, cash generation, balance sheet strength, competitive position, and management’s capital allocation discipline. These characteristics are not measured consistently across companies or advisers, and companies identified as high quality may underperform.
The Longest Phase of the Cycle
Fidelity Investments has done great work on the business cycle and divides the average one into four phases: early cycle, mid-cycle, late cycle, and recession. Their analysis reveals that early cycle periods tend to have a duration of about twelve months, while mid-cycle periods last nearly four years. Mid-cycle periods are also typically characterized by steady economic growth, healthy profitability, expanding credit, and a gradually more neutral policy backdrop.1, 3
The difference in duration between these two periods is crucial. While early cycle rebounds are often powerful, they also represent a relatively short portion of the overall business cycle expansion. Mid-cycle periods, on the other hand, last roughly four times longer. Also notable to us is that even though economic conditions typically remain constructive, the mid-cycle recovery provides less support to every company. As a result, returns become more dependent on company-by-company execution, cash generation, and improvements in the underlying quality of the business.
Importantly, this transition to the mid-cycle is more nuanced than the one from recession to early cycle. Whereas we typically see large selloffs in a recession and violent snapbacks in the early cycle, moving into the mid-cycle is more likely to be marked by a gradual moderation in the forces that drove the initial recovery. Comparisons become more difficult, inventories and sales move closer to equilibrium, and the benefits of operating leverage become less widespread. The economy may still be growing, but the composition of market leadership can begin to change before the cycle itself is clearly labeled.
The progression shown in Exhibit 1 closely mirrors the traits we emphasize across our portfolios at Conestoga. We seek to invest in companies that we believe exhibit durable organic growth, strong returns on invested capital, strong cash generation, conservative balance sheets, defensible competitive positions, and management teams that allocate capital thoughtfully.
Our belief is that these characteristics matter across a full cycle but become particularly evident as the initial recovery matures. For example, when demand outstrips supply in an early-cycle environment, many companies post improving results which exceed expectations, triggering inventory rebuilds, better operating margins, and forecasts for additional improvements.
These developments are also typically aided by lower interest rates, which are most beneficial to companies that rely most heavily on borrowed capital to run their businesses. However, as the cycle begins to mature, as appears to be the case today, the cost of capital begins to rise and puts incremental pressure on those same companies. This in turn causes investors to distinguish between companies benefiting from the cycle and those creating durable economic value.
Market Leadership Is Broadening
Another trend which has caught our attention is the broadening of market leadership. After years of a small group of Mega-cap companies accounting for an outsized share of index returns, performance in 2026 has become more widely distributed.5 (Past performance does not guarantee future results.)
Exhibit 2: Market Leadership is Broadening to Small Caps
Annual Total Return Average, %
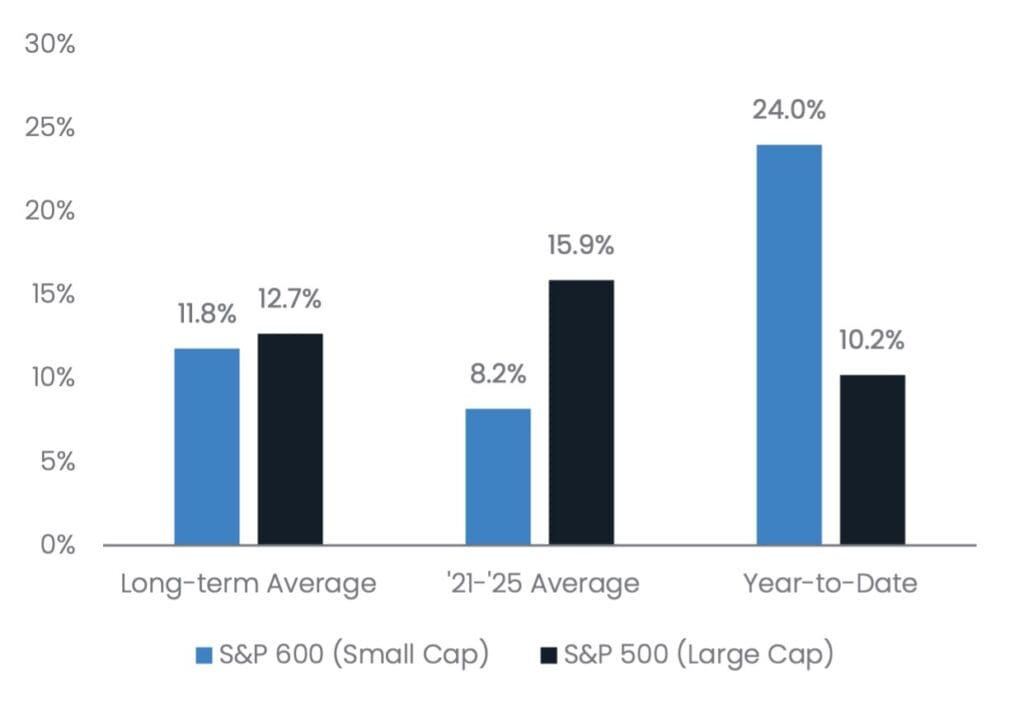
Source: Bloomberg Finance L.P. Data as of June 30, 2026. Note: Long-term measures from end of 1994 to end of 2025. Outlooks and past performance are not reliable indicators of future results. It is not possible to invest directly in an index. This bar chart shows the annual total return average for the S&P 600 and the S&P 500. The S&P 600 Index is a stock index tracking 600 small-cap U.S. companies meeting Standard & Poor’s criteria for liquidity and stability. The S&P 500 Index (Standard & Poor’s 500) is a float-adjusted market-capitalization-weighted stock market index that tracks the performance of 500 of the largest publicly traded companies in the United States.
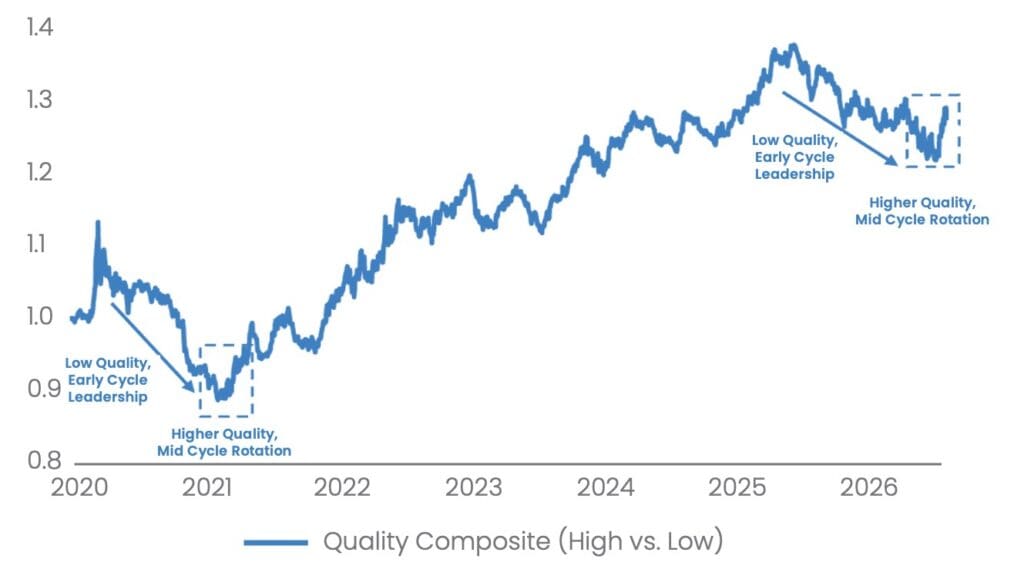
A similar development can be seen through a quality lens. As detailed in Exhibit 3, the early-to-mid-cycle transition highlights free cash flow, balance sheet strength, lower earnings variability, and higher margins among the characteristics receiving greater investor attention. This can also be seen comparing the current pattern with 2021, when the initial post-pandemic recovery matured and leadership moved away from some of the market’s more speculative areas.2
Exhibit 3: Quality Leadership Emerges as the Cycle Matures
Source: Compustat, Morgan Stanley Research. Past performance does not guarantee future results.
What Quality Means for Conestoga
At Conestoga, we don’t view quality as a single factor or accounting measure. Instead, we believe quality is reflected in a collection of business characteristics that support long-term value creation, such as sustainable revenue growth, strong returns on invested capital, significant free cash flow, conservative balance sheets, and management teams with a record of disciplined capital allocation and meaningful ownership. These are characteristics that can, for example, protect margins, reduce dependence on favorable interest rate or other financing markets, and provide companies with the flexibility to support continued investment when the macro environment becomes less certain.
Importantly, however, these are not merely defensive attributes. With the right management teams, free cash flow can be productively invested back into the business. Similarly, a strong balance sheet gives a company the flexibility to make improvements, from acquisitions to stock repurchases, while more highly leveraged competitors are capital constrained.
Similarly, while rapidly rising earnings growth can be exciting in the short-term, the quality of that growth over the longer term depends more on business strength in the form of everything from recurring revenues and pricing discipline to market share gains, margin stability, and shrewd capital allocation.
This is why our investment philosophy centers on the combination of sustainable growth and quality. We seek companies that we believe have the potential to approximately double their earnings over a three- to five-year period and compound returns over the long-term, as opposed to those chasing short-term opportunities. Doing this requires financial strength and strong management, in addition to durable growth opportunities, and we believe these characteristics are reflected throughout our portfolios.
Putting the Framework in Perspective
Every business cycle is unique. Therefore, our goal here is not to forecast the economy or stock market but rather to provide context for understanding how the underlying drivers of the business cycle can evolve even as an expansion continues seemingly unchanged.
History tells us the early-cycle period generally places a premium on sensitivity to improving conditions. As the expansion matures, the focus becomes more company-specific and quality-focused.
That distinction is central to our investment process at Conestoga, where we focus on owning companies whose growth, financial strength, and capital discipline can help support durable value creation across multiple business cycles and a range of market and economic environments.
Endnotes
1. Fidelity Investments Asset Allocation Research Team (AART), “The Business Cycle Approach to Asset Allocation,” updated January 2025.
2. Morgan Stanley Research, “The Broadening Out Shifts to a Quality Rotation as Early Cycle Phase Ends,” July 27, 2026.
3. Fidelity Investments Asset Allocation Research Team (AART), “The Business Cycle Approach to Equity Sector Investing,” May 2021.
4. Raymond James Institutional Equity Strategy, “Equal-Weighted Stocks Outperforming Through Volatility,” August 23, 2026.
5. JPMorgan, “Small Cap Success: Why This Rally Looks Different,” July 2, 2026
Disclosures
Past performance does not guarantee future results. Historical relationships shown may not persist, and actual client results may differ materially.
This material is for informational and educational purposes only and should not be construed as investment advice, a recommendation, or an offer or solicitation to buy or sell any security.
Opinions and forward-looking statements are as of the date of publication, are subject to change without notice, and may not come to pass. Forward-looking statements reflect Conestoga’s views as of the date indicated and are not guarantees of future results. Actual economic, market, company, portfolio, and investment results may differ materially.
Investing involves risk, including possible loss of principal. No investment strategy can guarantee a profit or protect against loss. Quality stocks and small-cap growth stocks can underperform other styles or the broader market. Higher-quality companies are not guaranteed to outperform, and valuation relationships can remain dislocated for extended periods. Small-cap companies may have less operating history, fewer financial resources, less liquidity, narrower product lines, and greater price volatility than larger companies. Small-cap stocks may underperform larger-company stocks.
Any indices and other financial benchmarks shown are provided for illustrative purposes only, are unmanaged, reflect reinvestment of income and dividends and do not reflect the impact of advisory fees. Investors cannot invest directly in an index. Comparisons to indexes have limitations because indexes have volatility and other material characteristics.
Investment Definitions: High-Quality: Conestoga defines high-quality as investing in companies with strong returns on capital, durable earnings growth, sturdy balance sheets, and meaningful management ownership. Earnings Growth is the percentage increase in a company’s net income or earnings per share (EPS) over a specific time period. Beta is a measure of the volatility, or systematic risk, of a security or a portfolio in comparison to the market as a whole. Return on Invested Capital (also known as Return on Capital) measures the profitability of a company as measured by its operating income in relation to the total capital invested in the company. Free Cash Flow (FCF) is the cash a company generates from its core operations after paying for its daily operations and long-term asset investments.
For additional information, please contact Conestoga Capital Advisors, LLC at: : info@conestogacapital.com.. You may also call us at 484-654-1380 or visit us on the web at www.conestogacapital.com.