IPOs: A Hidden Tailwind for Small Cap Stocks?
Download PDFFollowing more than a decade of below average IPO growth, recent data reveals this trend may be reversing and it could represent an underappreciated tailwind for Small Cap investors. As a reminder, one of the distinctive attributes of Small Cap investing is the ability to own shares in companies that are earlier in their life cycle, when growth and innovation are often just starting to accelerate. Initial Public Offerings (or IPOs) have historically acted as the key mechanism to bring these companies into the public markets.
Importantly, these new public companies provide more than just growth and innovation. To name a few, our view is that new IPOs can help to promote the attractive Small Cap attributes to a broader investor audience, improve overall market liquidity, and raise valuation multiples for existing public companies (as a new company’s stock often gets priced at a premium to existing competitors). It is with this in mind that we believe Small Cap investors have been patiently waiting for a reacceleration in IPO growth and there are early signs it may finally be happening.
Where Have All of the Stocks Gone?
With that as the backdrop, it surprises many to learn that despite significant gains for U.S. stock markets over the past 30 years, the Wilshire 5000 Total Market Index – which tracks the performance of every publicly traded company in the U.S. – no longer has 5,000 stocks in it. In fact, while it once contained over 7,000 stocks in the late 1990s, the total count today is down to approximately 3,500.
Exhibit 1: Number of U.S. Public Companies
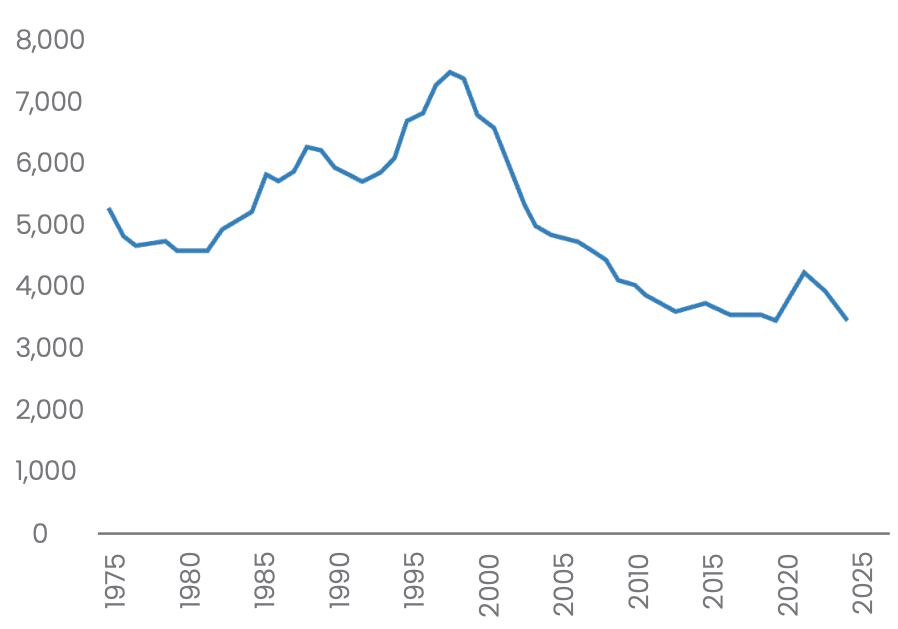
Source: Furey Research Partners, FactSet
The Historic Significance of IPOs for Small Caps
This is particularly important for Small Cap investors as lower market cap stocks typically represent the overwhelming majority of new public companies. According to Jay Ritter at the University of Florida¹, 95% of Initial Public Offerings since 1990 had a first day closing market cap below $2 billion, and about 99% of IPOs were below $5 billion. As a result, this decline in the total number of public companies has acted as a negative force for U.S. Small Cap market dynamics, restricting the growth and innovation which would typically come from new companies entering the public equity market. However, recent data shows this pattern may be changing for the better.
For context, let’s start by looking at the long-term trend. Our view is that the decline in the total number of public companies over the past 25 years is the result of a combination of factors, including:
- a return to equilibrium following the spike of IPOs during the Tech Bubble and the economic recession which followed
- investor fear and uncertainty surrounding both the Tech Bubble and the Global Financial Crisis, as well as new public company regulatory burdens and expenses which came out of each, headlined by Sarbanes–Oxley (2002) and Dodd-Frank (2010)
- the “zero interest rate policy” of the Federal Reserve through the 2010s, which encouraged companies with limited (or no) revenues, high expense bases, poor returns on capital, and/or high levels of debt to turn public
- the incredible growth in both Private Equity and Private Credit assets, which together effectively took many public companies private while concurrently keeping many others private
The Growth in IPOs is Inflecting Higher
What is noteworthy today is recent data showing that IPO activity is heating up. As you can see in Exhibit 2, there have been 253 IPOs per year on average since 2000, peaking in 2020/2021 during the boom in Special Purpose Companies (commonly known as SPACs). Total IPOs then retreated to 154 in 2023 but have since started to rebound, with 225 IPOs in 2024 and another 297 year-to-date in 2025 through October (which would already be the most since 2014, not including the SPAC boom of 2020/2021).
Exhibit 2: Annual IPOs, 2000-2025
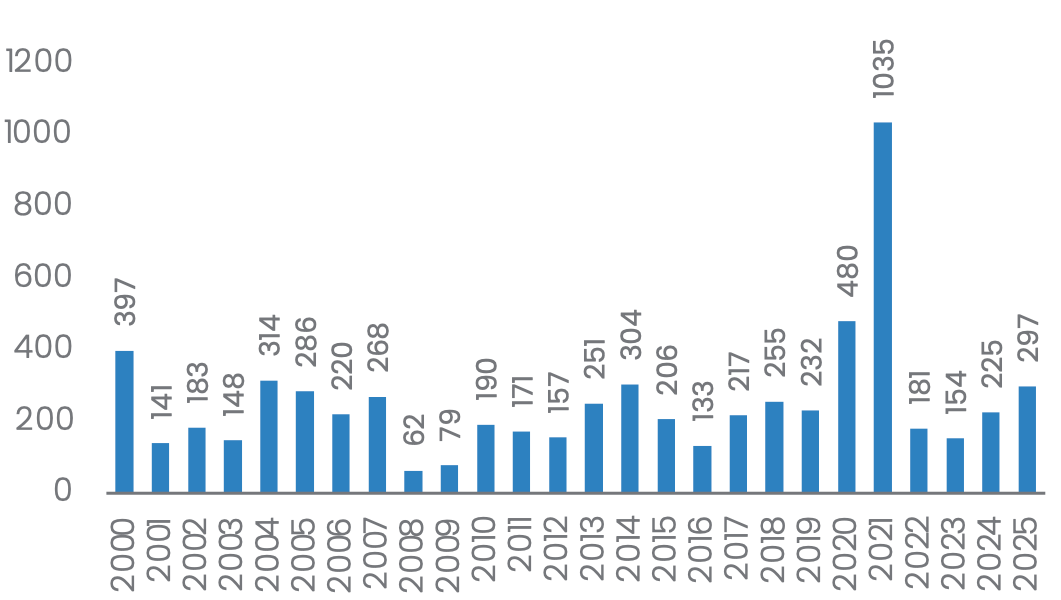
Source: StockAnalysis.com
Higher Deal Volumes Historically Occur in Years with Strong Small Cap Returns
This rise in IPO activity is notable because years with elevated numbers of IPOs historically correlate with strong return years in the Russell 2000 Index, as you can see in the chart below from Furey Research Partners. This makes intuitive sense as rising IPOs and stock returns tend to correspond with periods of improving macro conditions, lower interest rate expectations, and rising confidence.
Exhibit 3: IPOs vs. Small-Cap Returns (Annual)
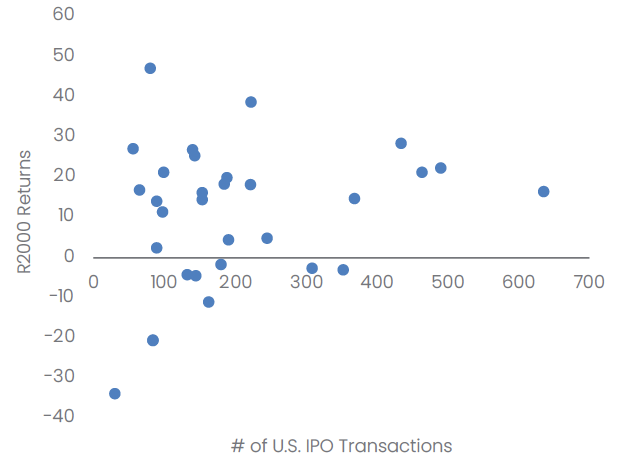
Source: Furey Research Partners, FactSet
The Vast Majority of M&A Targets Historically are Small Caps
What else tends to rise during these periods? Merger-and-acquisition activity; and, again, we’re seeing a rise in M&A deals coming out of a recent low in 2023. Just as significant, similar to how the majority of IPOs are Small Caps, the percentage of M&A targets has skewed heavily over time towards Small Caps as well. As detailed below, Small Caps have represented approximately 80–90% of all U.S. public M&A deals since 1994, as larger companies choose to acquire rather than develop new growth opportunities.
Exhibit 4: Trailing 12-Month U.S. Public M&A Transactions

Source: Furey Research Partners, FactSet
Conclusion
In conclusion, our belief is that a variety of market forces – from lower interest rates to rising GDP growth, strengthening sentiment, and deregulatory policy reform in Washington D.C. – are signaling an ongoing reacceleration in U.S. IPOs. When combined with accelerating earnings growth, historically cheap valuation, and a long-in-the-tooth Large Cap outperformance cycle, the benefits of this could create a virtuous circle for Small Cap equities and potentially even start re-expanding the overall number of U.S. public companies.
Footnotes
1 Jay R. Ritter, “IPO Data,” University of Florida, November 6, 2025, https://site.warrington.ufl.edu/ritter/ipo-data/
Disclosures
This document does not constitute advice or a recommendation or offer to sell or a solicitation to deal in any security or financial product. It is provided for information purposes only and on the understanding that the recipient has sufficient knowledge and experience to be able to understand and make their own evaluation of the proposals and services described herein, any risks associated therewith and any related legal, tax, accounting or other material considerations. To the extent that the reader has any questions regarding the applicability of any specific issue discussed above to their specific portfolio or situation, prospective investors are encouraged to contact Conestoga Capital Advisors, LLC.
This document is confidential, is intended only for the person to whom it has been directly provided and under no circumstances may a copy be shown, copied, transmitted or otherwise be given to any person other than the authorized recipient without the prior written consent of Conestoga Capital Advisors, LLC.
Past performance is not a guarantee or indicator of future results.
Any indices and other financial benchmarks shown are provided for illustrative purposes only, are unmanaged, reflect reinvestment of income and dividends and do not reflect the impact of advisory fees. Investors cannot invest directly in an index. Comparisons to indexes have limitations because indexes have volatility and other material characteristics.
Certain information contained herein constitutes “forward-looking statements”. Due to various risks and uncertainties, actual events, results or actual performance may differ materially from those reflected or contemplated in such forward-looking statements. Nothing contained herein may be relied upon as a guarantee, promise, assurance or a representation as to the future.
Investment Definitions: Wilshire 5000 Total Market Index: The Wilshire 5000 Total Market Index, or more simply the Wilshire 5000, is a market capitalization-weighted index of the market value of all American stocks actively traded in the United States. Tech Bubble: A tech bubble is a period when technology stock prices skyrocket due to speculative investor enthusiasm, leading to valuations that are not supported by the companies’ fundamentals, before inevitably crashing. Gross Domestic Product (GDP): Gross Domestic Product (GDP) is the market value of all final goods and services produced within the U.S. in a specific period, representing the total economic output.
For additional information contact: info@conestogacapital.com. You may also call us at 484-654-1380 or visit us on the web at www.conestogacapital.com.