Extreme Large Cap Valuations Signal Opportunity in Small Caps
Download PDFNow more than fifteen years into a Large Cap bull market which began in the aftermath of the Global Financial Crisis, a few publications caught our attention as they effectively highlight the increasingly stretched valuation premium in Large Cap stocks as well as the growing opportunity in Small Caps.
First, a recent FactSet report states that the forward 12-month Price/Earnings (P/E) ratio of the S&P 500 Index reached 23.1 on October 29, 2025, a level which is slightly below the Large Cap index’s 30-year peak of 24.4 but still in excess of the index’s trailing 5-year (19.9), 10-year (18.6), 15-year (17.0), 20-year (16.1), and 25-year (16.3) averages.
Exhibit 1: S&P 500 Forward 12-Month P/E Ratio: 25 Years
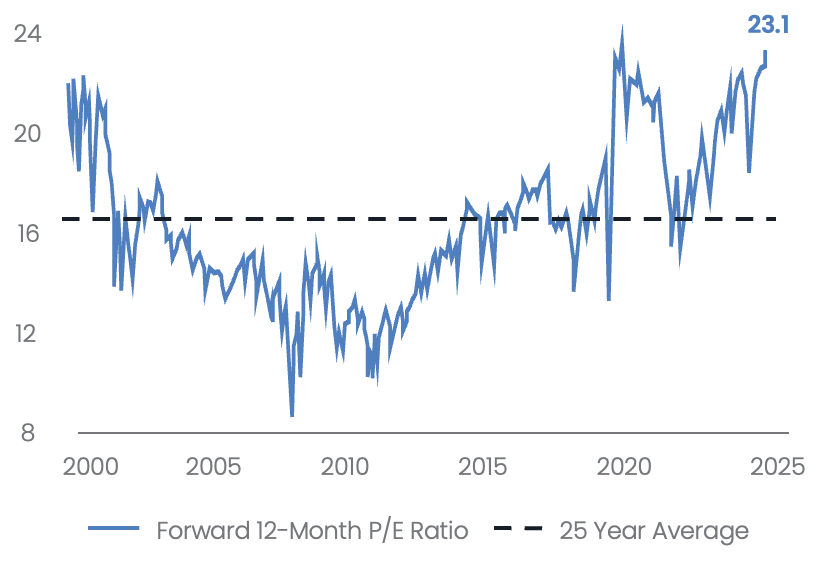
Source: FactSet
While this is interesting on its own, we find it particularly noteworthy, given the performance leadership of the Mega Cap “Magnificent 7” stocks, that the report goes on to report that this extended index-level valuation is not concentrated in any single sector or industry. In fact, it states that 10 of the 11 S&P 500 Index sectors have forward 12-month P/Es exceeding their respective 25-year averages, led by Information Technology (32.0 vs. 20.3), Consumer Discretionary (29.2 vs. 20.1), Industrials (24.5 vs. 17.0), and Communication Services (22.1 vs. 16.1). The only sector which does not is Real Estate and that is because a 25-year P/E is not available.
Exhibit 2: S&P 500 Sector Forward 12-Month P/E Ratios: Oct. 29 vs 25-Year Avg.

Source: FactSet
Next, Apollo Global Management recently published a chart comparing two archetypical and often cited equity market valuation metrics – the Shiller CAPE ratio and the “Buffet Indicator” – and the data here also reveals that the S&P 500 Index is trading at valuations levels we’ve rarely (if ever) seen before.
For background, the Shiller CAPE ratio (short for Cyclically Adjusted Price-to-Earnings ratio) was developed by economist Robert Shiller and compares the current price of an index with the average of its inflation-adjusted earnings over the past 10 years, effectively smoothing out short-term fluctuations in earnings and providing a more stable, longer-range assessment of the current valuation environment. Considering this framework, it is remarkable to us that the Shiller CAPE ratio, which averages 17x over the long term, currently exceeds 40x.
By the same token, the current ratio of Total U.S. Stock Market Capitalization-to-Gross Domestic Product – otherwise known as the “Buffet Indicator” – is also higher than during previously elevated periods going back to the 1980s. This dynamic came to be named for the legendary Warren Buffet following his quote in 2001 that it was “probably the best single measure of where valuations stand at any given moment.”
In today’s case, whereas the total U.S. stock market capitalization averages 157% of the size of U.S. GDP over the long-term, the current reading is closer to 215%. While each metric appears extreme individually, in our view, when placed in context of each other and compared to prior phases of elevated stock market valuations – as in Exhibit 2 – the combination of the two effectively places 2025 in uncharted territory.
Exhibit 3: Buffet Indicator and Shiller CAPE at Extreme Levels
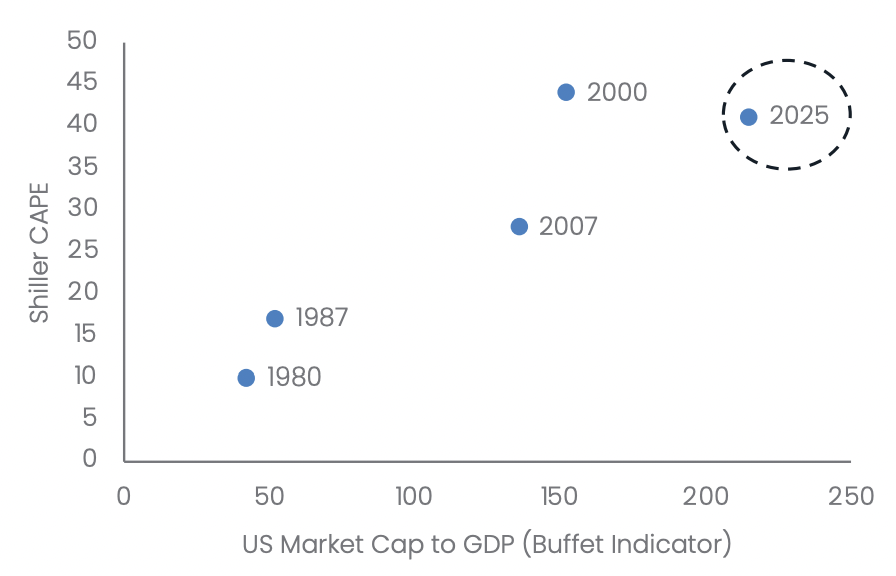
Source: WDI, Robert Shiller, Macrobond, Bloomberg, Apollo Chief Economist
This is even more interesting to us when we consider that Small Caps, as defined by the Russell 2000 Index (ex. Biopharma), are currently trading at a nearly -10% discount to the S&P 500 Index. This stands in stark contrast to the historical relationship between these two groups where, as you can see in Exhibit 4, Small Caps trade at an average 10% premium to Large Caps over time and have only been cheaper during the Tech Bubble.
Exhibit 4: Relative NTM P/E (Russell 2000 Index ex. Biopharma / S&P 500 Index, Bottom-Up)
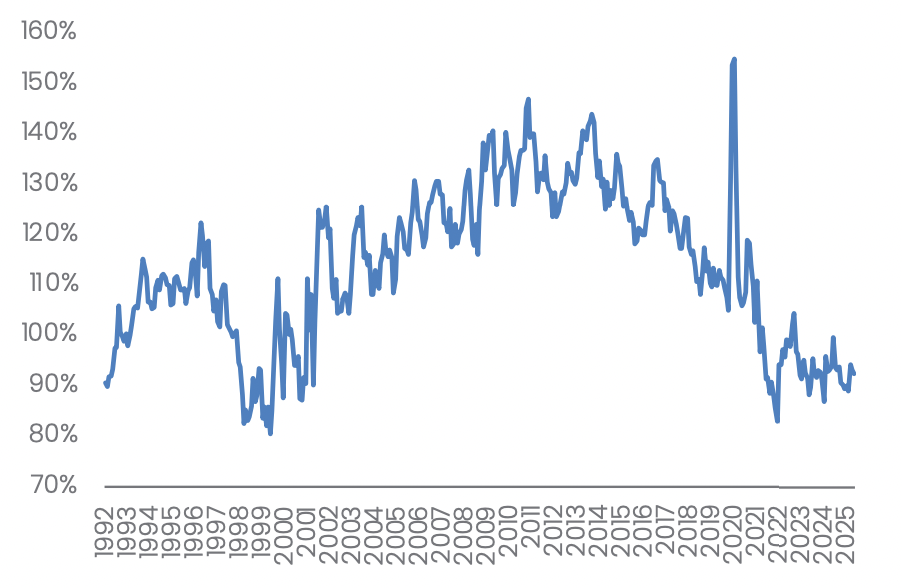
Source: Furey Research Partners & FactSet; as of 10/31/25; Bottom-up methodology aggregates all companies’ market cap and then divides that value by the aggregate earnings of all companies
In conclusion, the Large Cap S&P 500 Index is currently trading at a valuation level characterized as “extreme” by Apollo 1 and “above the five most recent historical averages” by FactSet2, while Small Caps are trading close to a 33-year relative valuation low. At the same time, following two years of contraction, Small Cap earnings growth is not only accelerating but forecasted to exceed that of Large Caps in 20263. As such, we believe the case for future Small Cap outperformance is becoming increasingly formidable.
Footnotes
1 Torsten Slok, “Extreme Valuations for the S&P500,” Apollo Academy (November 6, 2025), https://www.apolloacademy.com/extreme-valuations-for-the-sp-500/utm_id=2d98dd29223093e2738f6229d72064f1
2 John Butters, “Highest Forward 12-Month P/E Ratio For the S&P 500 in More Than 5 Years,” FactSet Insight (November 4, 2025), https://insight.factset.com/highest-forward-12-month-p/e-ratio-for-the-sp-500-in-more-than-5-years
3 John Galvin, “Small-Cap 3Q25 Earnings Running Stronger Than Expected,” Furey Research Partners (November 14, 2025)
Disclosures
This document does not constitute advice or a recommendation or offer to sell or a solicitation to deal in any security or financial product. It is provided for information purposes only and on the understanding that the recipient has sufficient knowledge and experience to be able to understand and make their own evaluation of the proposals and services described herein, any risks associated therewith and any related legal, tax, accounting or other material considerations. To the extent that the reader has any questions regarding the applicability of any specific issue discussed above to their specific portfolio or situation, prospective investors are encouraged to contact Conestoga Capital Advisors, LLC.
This document is confidential, is intended only for the person to whom it has been directly provided and under no circumstances may a copy be shown, copied, transmitted or otherwise be given to any person other than the authorized recipient without the prior written consent of Conestoga Capital Advisors, LLC.
Past performance is not a guarantee or indicator of future results.
Any indices and other financial benchmarks shown are provided for illustrative purposes only, are unmanaged, reflect reinvestment of income and dividends and do not reflect the impact of advisory fees. Investors cannot invest directly in an index. Comparisons to indexes have limitations because indexes have volatility and other material characteristics.
Certain information contained herein constitutes “forward-looking statements”. Due to various risks and uncertainties, actual events, results or actual performance may differ materially from those reflected or contemplated in such forward-looking statements. Nothing contained herein may be relied upon as a guarantee, promise, assurance or a representation as to the future.
Investment Definitions: S&P 500 Index: The Standard and Poor’s 500, or simply the S&P 500, is a stock market index tracking the stock performance of 500 leading companies listed on stock exchanges in the United States. Price/Earnings (P/E) Ratio: The price-to-earnings (P/E) ratio is a stock valuation that shows how much investors are willing to pay for each dollar of a company’s earnings and is used to assess if a stock is overvalued or undervalued. The P/E ratio has different types, such as trailing (based on past earnings) and forward (based on future earnings estimates such as next twelve months). Mega Cap ‘Magnificent 7’: Mega Cap ‘Magnificent 7’ refers to seven mega-capitalization technology companies that have dominated recent stock market performance: Alphabet (Google), Amazon, Apple, Meta Platforms, Microsoft, Nvidia, and Tesla. These companies are leaders in their respective fields, including AI, cloud computing, e-commerce, and consumer electronics, and their strong performance has been a major driver of overall market returns. Gross Domestic Product (GDP): Gross Domestic Product (GDP) is the market value of all final goods and services produced within the U.S. in a specific period, representing the total economic output. Market Capitalization: Market capitalization is the current value of a publicly traded company, based on the total dollar amount that all of its outstanding shares are worth. Tech Bubble: A tech bubble is a period when technology stock prices skyrocket due to speculative investor enthusiasm, leading to valuations that are not supported by the companies’ fundamentals, before inevitably crashing.
For additional information contact: info@conestogacapital.com. You may also call us at 484-654-1380 or visit us on the web at www.conestogacapital.com.