Why Quality Matters in Small Cap Growth
Download PDFRarely do you hear anyone on CNBC say they enjoy investing in companies with poor balance sheets, a lack of cash flow, and low (or no) earnings. We believe there’s a simple reason for that: while investing in speculative stocks can work for a short period of time, over the long run it’s a losing strategy, especially in Small Caps. Historically, high-quality companies have meaningfully outperformed both the broader market and their lower-quality peers. That long-term reality can be easy to forget during short bursts when low-quality stocks surge, as they did between April and October in 2025, but we believe the environment is shifting back in favor of quality in 2026.
So, what do we mean by “high quality”? At Conestoga Capital Advisors, we define it as investing in companies with strong returns on capital, durable earnings growth, sturdy balance sheets, and meaningful management ownership. We then pair that focus with a long-term, multi-year investment horizon. Our discipline has historically been associated with low turnover and competitive risk-adjusted results, as we believe our patient approach has given our holdings the time needed to realize the full value of their high-quality business models across complete market and economic cycles.*
Exhibit 1: % Unprofitable (Russell 2000 Growth)
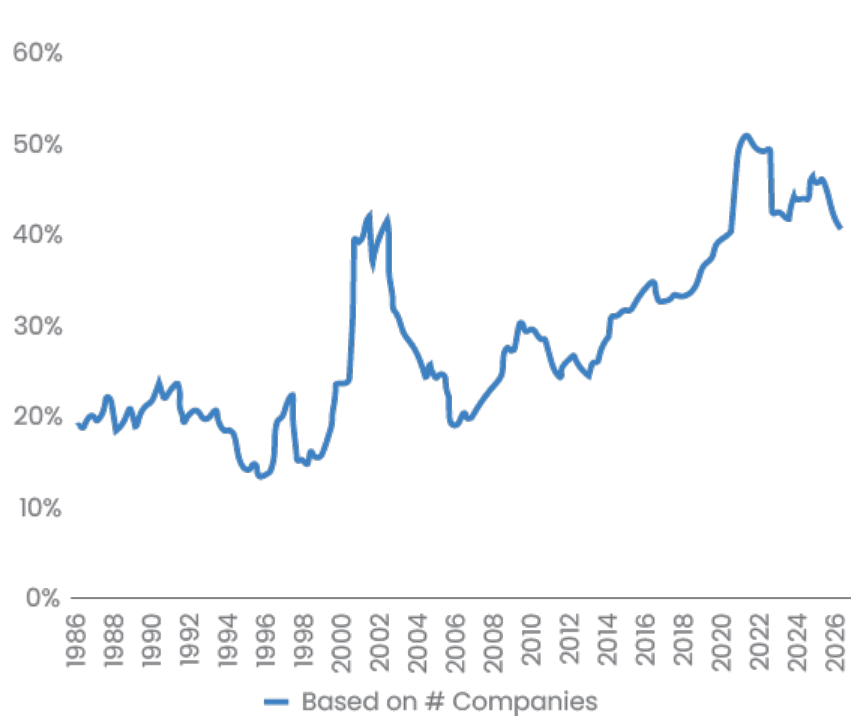
Source: Furey Research Partners, FactSet; as of 1/31/26
We believe this type of approach is increasingly important in Small Cap investing. Two points make that clear. First, a rising portion of the Small Cap public equity universe is comprised of money-losing companies, with over 40% of companies in our Russell 2000 Growth Index benchmark currently unprofitable (Exhibit 1). Second, high-quality Small Cap stocks have outperformed both the Russell 2000 Index and low quality Small Caps across the trailing 1-, 3-, 5-, 10-, 15-, and 20-year periods. In fact, since 2005, high quality outperformed low quality by more than 2% per year annualized (Exhibit 2).
As a result, we see a compelling case for Small Cap outperformance looking forward, supported by accelerating earnings growth and attractive valuations relative to Large Caps, as well as an improving U.S. domestic economic backdrop. Within that opportunity set, we believe the high-quality Small Cap growth companies we own are well positioned to rebound from the challenges of 2025 and reassert the leadership they have delivered over full market cycles.
Exhibit 2: Trailing Annualized Returns
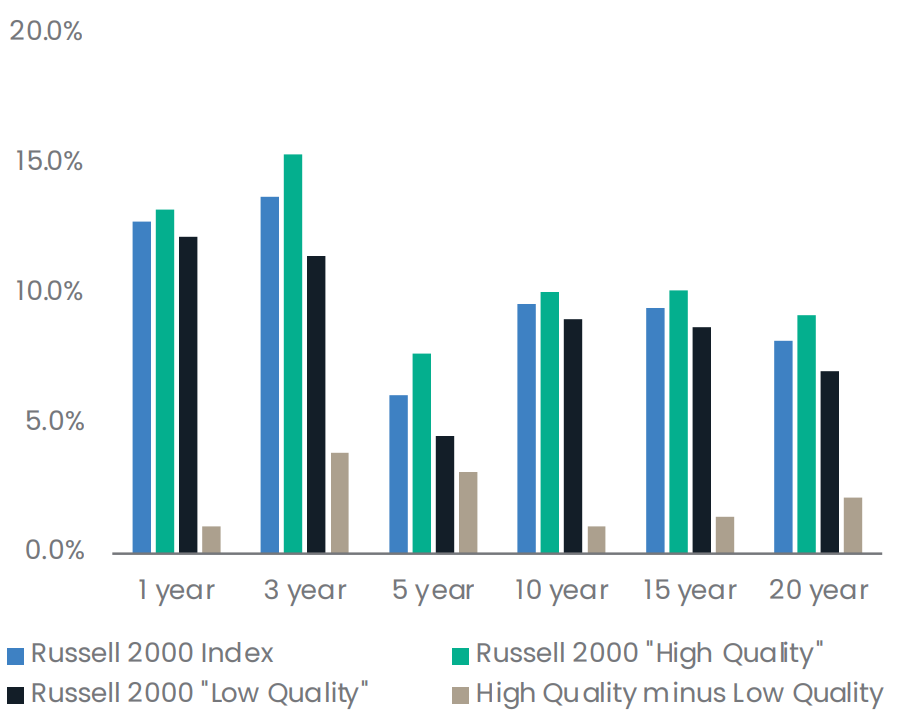
Source: Furey Research Partners, FactSet, and Conestoga; as of 12/31/25. Furey Research Partners defines Quality as follows: For Financials and Real Estate companies, Quality is based solely on Return on Assets (ROA). For all other companies, Quality is defined by leverage, Return on Assets (return), change in asset turnover (efficiency), and accruals (earnings quality).
Footnotes
* There is no guarantee of future performance. See the Conestoga Small Cap Composite performance for details and time periods at www.conestogacapital.com.
Disclosures
This document does not constitute advice or a recommendation or offer to sell or a solicitation to deal in any security or financial product. It is provided for information purposes only and on the understanding that the recipient has sufficient knowledge and experience to be able to understand and make their own evaluation of the proposals and services described herein, any risks associated therewith, and any related legal, tax, accounting, or other material considerations. To the extent that the reader has any questions regarding the applicability of any specific issue discussed above to their specific portfolio or situation, prospective investors are encouraged to contact Conestoga Capital Advisors, LLC.
Investing involves risk, including possible loss of principal. Small-cap securities may be more volatile and less liquid than larger companies. Past performance is not a guarantee or indicator of future results. There is no guarantee the strategy will achieve its objectives or that high-quality stocks will outperform in the future.
Certain information contained herein constitutes “forward-looking statements.” Due to various risks and uncertainties, actual events, results, or actual performance may differ materially from those reflected or contemplated in such forward-looking statements. Nothing contained herein may be relied upon as a guarantee, promise, assurance, or a representation as to the future.
The Russell 2000 and Russell 2000 Growth Indexes are unmanaged and cannot be invested in directly. Index performance does not reflect management fees, transaction costs, or other expenses. Comparisons to indexes have limitations because indexes have volatility and other material characteristics.
Investment Definitions: Return on Assets (ROA) is a financial ratio that measures a company’s profitability relative to its total assets, indicating how efficiently management uses its resources to generate profit. Expressed as a percentage, a higher ROA shows better asset utilization, while a lower ROA suggests inefficiency. The Russell 2000 Index measures the performance of the small cap segment of the U.S. equity universe. It includes approximately 2,000 of the smallest securities based on a combination of their market cap and current index membership. The Russell 2000 Growth Index measures the performance of the small cap growth segment of the U.S. equity universe. It includes those Russell 2000 companies with higher price-to-value ratios and higher forecasted growth values. Return on Invested Capital: (Net income + ((interest expense on debt – interest capitalized) * (1 – tax rate))) / average of last year’s and current year’s (total capital + short-term debt and current portion of long-term debt). The Return on Invested Capital (also known as Return on Capital) measures the profitability of a company as measured by its operating income in relation to the total capital invested in the company. Earnings Growth measures the percentage increase in a company’s net income or earnings per share (EPS) over a specific period, quarterly or annually, compared to a previous period. It indicates a company’s increasing profitability, efficiency, and ability to generate higher returns, often serving as a primary driver of stock performance. Annual Turnover is the lesser of the market value of purchases or sales of portfolio securities over the past twelve months, divided by the monthly average market value of the securities held during the past twelve months.
Distributed by Conestoga Capital Advisors, Member FINRA/SIPC. For additional information contact: info@conestogacapital.com. You may also call us at 484-654-1380 or visit us on the web at www.conestogacapital.com.